FHIR Forward: Revolutionizing MSSP Quality Reporting
Abstract
As a healthcare provider, it is our duty to improve upon the care we deliver to the communities we serve. Monitoring performance is an important part of the life cycle of maturing and improving care. Performance reporting should impose minimal administrative burden on clinicians while significantly contributing to the enhancement of high value patient care. The healthcare technical infrastructure that exists at large in the United States today makes quality reporting incredibly burdensome, costly, and slow. To evaluate an alternative that would reduce the burden, cost, and improve the speed of reporting while maintaining data integrity, our accountable care entity conducted an AB study to explore the use of Fast Healthcare Interoperability Resources (FHIR), specifically bulk FHIR and a cloud technical infrastructure to report quality measures required by the Centers for Medicare and Medicaid Innovation (CMMI) Medicare Shared Savings Program (MSSP). The results showed a favorable outcome in achieving all three objectives: lower cost and burden, improved cycle time for reporting, and high integrity of results utilizing the regulated APIs required of certified electronic medical records. Utilizing bulk FHIR for reporting quality measures enabled the Accountable Care Organization (ACO) to report quality for a total of approximately $22,000 dollars in performance year 2024. This solution can be licensed and replicated across both government and commercial payers, significantly reducing redundant infrastructures required to report on the patients we serve. MultiCare will continue to invest and partner with payers that enable each partner to succeed in delivering high quality care to our communities and will continue to support the use of FHIR and bulk FHIR in our operations.
Background
MultiCare Health System participates in several models from the Centers for Medicare and Medicaid Innovation. As part of participation in these models and the legal requirement for functioning as a Clinically Integrated Network, they are required to report quality measures. These measures are reported through the Quality Payment Program (QPP). This case study will focus on the quality reporting for the Medicare Shared Savings Program (MSSP). There were four methodologies available for reporting quality measures for the performance year 2024 (reported in Q1 2025):
- Web Interface
- eCQM
- MIPS CQMs
- Medicare CQMs
| MIPS CQM | eCQMs | Medicare CQMs | Web Interface | |
|---|---|---|---|---|
| Data Accepted | Flat files, registry, EHR, manual abstraction | QRDA I files produced directly from Qualified CEHRT EHRs | Flat files, registry, EHR, manual abstraction | Excel template uploaded to QPP |
| Data Completeness Requirements | 75% | Assumes 100% | 75% | 248 consecutive for each measure |
| Scope of Reporting | All patients, All payers | All patients, All payers | Only MSSP beneficiaries that meet assignment criteria | Only CMS sampled MSSP beneficiaries |
| Benchmarks | Higher than eCQMs | Benchmarks lower than MIPS CQMs | Unknown; Likely higher than eCQM and MIPS CQM | High; Most in the 80th percentile + |
MultiCare Health Partners is the ACO that was utilized in this case study. Since this ACO was in its initial year and was eligible for pay-for-reporting in 2024, it was suitable for researching various methodologies for reporting quality. The patient data for this ACO is maintained by three electronic health record (EHR) vendors: Epic, eClinical Works, and NextGen.
Choosing a Reporting Methodology
The following requirements were utilized to choose the two reporting methodologies for performance year 2024:
- Scalable to a larger sample size
- Low cost
- Automation that maintains the integrity of the source data
- Low administrative burden to the clinician
- Enables both small independent and large integrated systems
The two methods chosen for reporting were as follows: (1) Web Interface, as the control group; (2) Medicare CQMs, as the test methodology for bulk FHIR.
| Medicare CQMs | Web Interface | |
|---|---|---|
| Data Accepted | Flat files, registry, EHR, manual abstraction | Excel template uploaded to QPP |
| Data Completeness Requirements | 75% | 248 consecutive for each measure |
| Scope of Reporting | Only MSSP beneficiaries + a few others | Only CMS sampled MSSP beneficiaries |
| Benchmarks | Unknown; Likely higher than eCQM and MIPS CQM | High; Most in the 80th percentile + |
Reporting Population & Measures
Medicare CQMs
Under the Medicare CQM (Clinical Quality measures) methodology, ACOs are responsible for reporting on all Medicare Fee-For-Service beneficiaries that meet assignment criteria under the Shared Savings Program. The ACO had a total of approximately 14,000 patients eligible for reporting under Medicare CQMs, compared to about 6,400 beneficiaries who were assigned to the ACO. Medicare CQMs required reporting of three measures for PY 2024:
| Measure # | Measure Title | Collection Type | Measure Type |
|---|---|---|---|
| 001 | Diabetes: Hemoglobin A1c (HbA1c) Poor Control (>9%) | Medicare CQM | Outcome |
| 134 | Screening for Depression and Follow-Up Plan | Medicare CQM | Process |
| 236 | Controlling High Blood Pressure | Medicare CQM | Outcome |
Web Interface
Web Interface requires a sample of patients that range from 250 – 1000 lives, per measure, and includes the following ten measures:
| Measure # | Measure Title | Collection Type | Measure Type |
|---|---|---|---|
| 001 | Diabetes: Hemoglobin A1c (HbA1c) Poor Control (>9%) | CMS Web Interface | Outcome |
| 134 | Screening for Depression and Follow-Up Plan | CMS Web Interface | Process |
| 236 | Controlling High Blood Pressure | CMS Web Interface | Outcome |
| 318 | Screening for Future Fall Risk | CMS Web Interface | Process |
| 110 | Influenza Immunization | CMS Web Interface | Process |
| 226 | Tobacco Use: Screening and Cessation Intervention | CMS Web Interface | Process |
| 113 | Colorectal Cancer Screening | CMS Web Interface | Process |
| 112 | Breast Cancer Screening | CMS Web Interface | Process |
| 438 | Statin Therapy for the Prevention and Treatment of Cardiovascular Disease | CMS Web Interface | Process |
| 370 | Depression Remission at Twelve Months | CMS Web Interface | Outcome |
Web interface is a well-known historical method used today to report quality measures; however, this methodology will be retiring as an option for 2025 Performance Year reporting. All ACOs will be required to choose from the remaining three options of reporting.
Methodologies
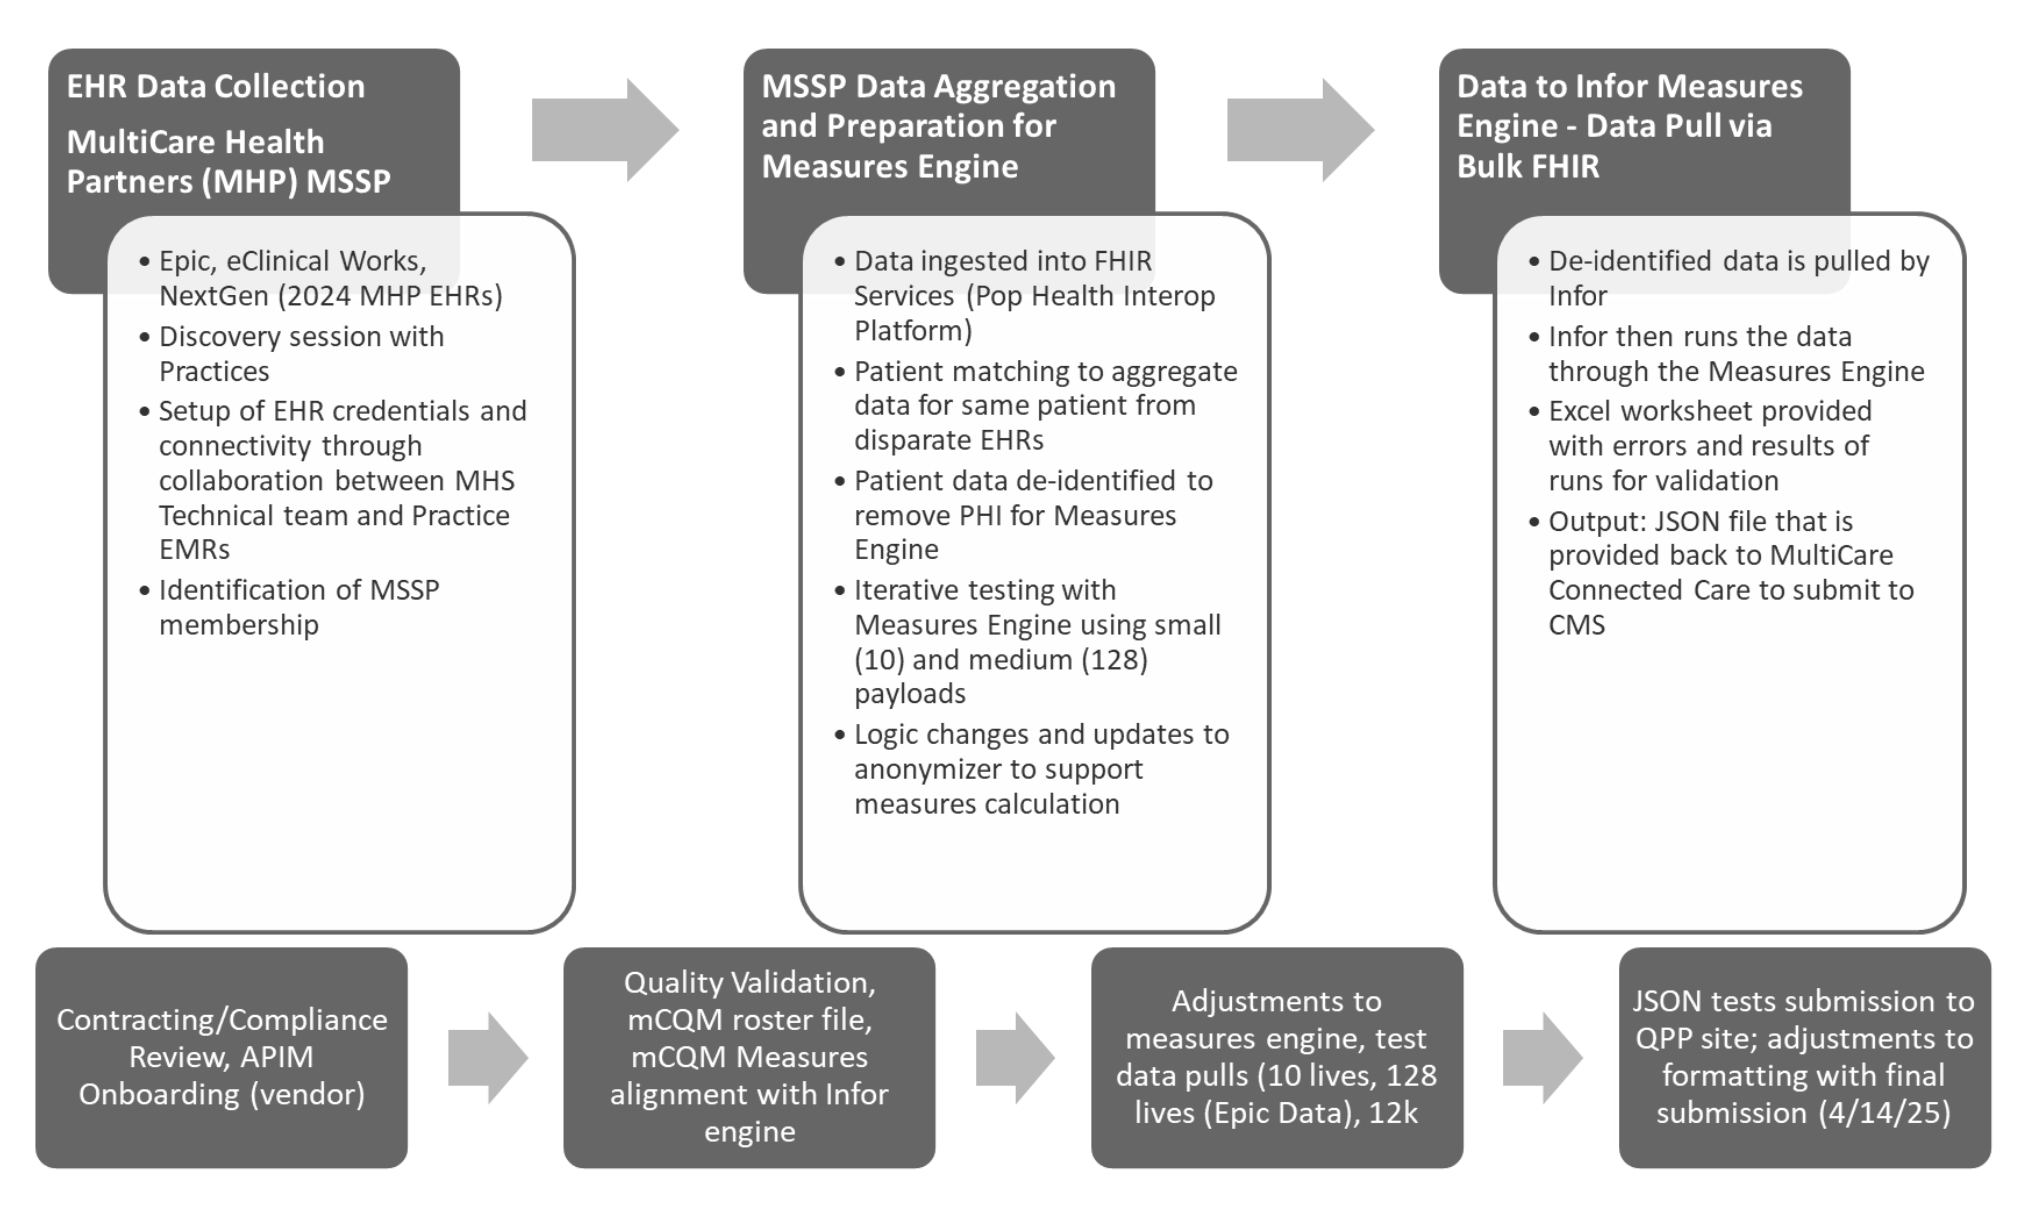
Figure 1 - Medicare CQM Reporting Process
The steps in the Medicare CQM Process from data ingestion to results:
- Patient Identification and Matching
- Patient Identification - The MultiCare team used patient metadata [given name, family name, date of birth and sex] when identifying patients in the source EHR and Database systems. When an exact match was not found, the team manually identified the unique identifier for the patient. Manual matches accounted for approximately 3-5%, and within that sample, two patients could not be matched to the data sets.
- Patient Matching - As resources are added to the FHIR Service, the system uses an insert/update process that merges the input patient with the existing patient.
- Data Ingestion - Data was retrieved from the source EHR and staged before ingestion into the FHIR Service utilizing a Da Vinci Implementation Guide (Clinical Data Exchange (Cdex)). Staged patient data was matched against the existing patient data, and where mergers were needed, patient resources were merged in the FHIR Service, and staged data was updated, with references updated to the ID of the existing FHIR Patient resource.
- Epic - Bulk Extract
- The MultiCare team determined that the Epic Bulk Extract process presented too many barriers to success.
- Manual creation and maintenance of groups created a dependency on regular manual intervention to maintain groups, as group membership changes. There is not currently the ability to programmatically create the container of patients that would allow MultiCare to then perform a bulk export from Epic.
- Groups are limited to 1000 members, while Epic has advised that this is not a hard limit, this introduces a need to create many groups for a single population, increasing the complexity and risk associated with group membership maintenance.
- The response time for the Epic Bulk Export was too slow, taking over 24 hours to complete a single group export, with a potential population of 60k+ patients for the 2025 reporting year, Epic Bulk export was not as scalable as needed.
- Epic Manual Extract (Utilizing DaVinci Implementation Guide of Clinical Data Exchange (Cdex))
- Utilizing the Da Vinci Implementation Guide of Cdex - USCDI, and some industry standard APIs hosted by Epic, allowed the team to retrieve FHIR resources, sufficient to build a patient Bundle. The bundle consists of the patient resource, all resources directly attributed to the patient, and all references for the attributed resources.
- This process, internally referred to as the “chatty” process, executes hundreds of API calls to the Electronic Health Record (EHR) system, to collect the required information for a single patient.
- NextGen Data Ingestion Bulk Extract
- The NextGen team exposed Patient and Group APIs that mitigated the issues presented by Epic. The MultiCare team used these APIs to identify patient identifiers for the members, and to create the appropriate groups required to execute a bulk export.
- The automation of the group creation/maintenance allowed MultiCare to extract data with four concurrent bulk extracts, containing data for ~3300 members.
- eClinical Works Database Ingestion – Database Conversion (One participating provider group migrated from eClinicalWorks to Epic mid performance-year, we did not explore bulk because we deprecated this product).
- Subject matter experts developed the queries to extract the required data from the database server. With the raw data mapped to FHIR Resources, the conversion was straight forward. Existing identifiers (primary key/composite key) were maintained within the Identifiers attribute.
- Converted data was staged, then filtered to those patients in the desired population before being released for ingestion.
- Epic - Bulk Extract
- Deidentification
- Bundle Deidentification – PHI and PII are not required for the measure engine to output the measure results. Infor developed a configurable, deidentification service that removed non-required elements from the patient bundle. The deidentified data was stored in the FHIR Service configured for measure reporting interoperability.
- Group Attribution - Group creation and maintenance
- A FHIR Group resource was created, with references for the appropriate members. Our partners could retrieve the data required for the quality measure engine, using a bulk export process, keyed to the identifier of the Group resource.
- As membership changes were reported to MultiCare, the Group resource was updated to reflect the changes to the membership.
- Measure Evaluation
- Measure Evaluation and transmission - Using the bulk export process, MultiCare’s partner, Infor, extracted the deidentified data and produced outputs such as the Sample Output. MultiCare successfully submitted the generated file to CMS by uploading the JavaScript Object Notation (JSON) output to the CMS site. Please see the appendix for more information about Infor’s population health solution, IPHA.
-
Sample Output:
  {
      "entityId": "{entityId}",
      "entityType": "apm",
      "performanceYear": 2024,
      "measurementSets": [
          {
              "programName": "app1",
              "category": "quality",
              "submissionMethod": "registry",
              "performanceStart": "2024-01-01",
              "performanceEnd": "2024-12-31",
              "measurements": [
                  {
                      "measureId": "001",
                      "value": {
                          "isEndToEndReported": false,
                          "performanceMet": XX4,
                          "performanceNotMet": XX7,
                          "eligiblePopulation": XX1,
                          "eligiblePopulationExclusion": null
                      }
                  },
                  {
                      "measureId": "134",
                      "value": {
                          8
                          "isEndToEndReported": false,
                          "performanceMet": XX1,
                          "performanceNotMet": XX9,
                          "eligiblePopulation": XX3,
                          "eligiblePopulationExclusion": null,
                          "eligiblePopulationException": XX3
                      }
                  },
                  {
                      "measureId": "236",
                      "value": {
                          "isEndToEndReported": false,
                          "performanceMet": XX8,
                          "performanceNotMet": XX3,
                          "eligiblePopulation": XX1,
                          "eligiblePopulationExclusion": null
                      }
                  }
              ]
          }
      ]
  }
Preliminary Results
Medicare CQM Reporting
| Measure # | Measure Title | Collection Type | Performance Rate |
|---|---|---|---|
| 001 | Diabetes: Hemoglobin A1c (HbA1c) Poor Control (>9%) | Medicare CQM | CMS embargo |
| 134 | Screening for Depression and Follow-Up Plan | Medicare CQM | CMS embargo |
| 236 | Controlling High Blood Pressure | Medicare CQM | CMS embargo |
CMS Web Interface Reporting
| Measure # | Measure Title | Collection Type | Performance Rate |
|---|---|---|---|
| 001 | Diabetes: Hemoglobin A1c (HbA1c) Poor Control (>9%) | CMS Web Interface | CMS embargo |
| 134 | Screening for Depression and Follow-Up Plan | CMS Web Interface | CMS embargo |
| 236 | Controlling High Blood Pressure | CMS Web Interface | CMS embargo |
| 318 | Screening for Future Fall Risk | CMS Web Interface | CMS embargo |
| 110 | Influenza Immunization | CMS Web Interface | CMS embargo |
| 226 | Tobacco Use: Screening and Cessation Intervention | CMS Web Interface | CMS embargo |
| 113 | Colorectal Cancer Screening | CMS Web Interface | CMS embargo |
| 112 | Breast Cancer Screening | CMS Web Interface | CMS embargo |
| 438 | Statin Therapy for the Prevention and Treatment of Cardiovascular Disease | CMS Web Interface | CMS embargo |
| 370 | Depression Remission at Twelve Months | CMS Web Interface | CMS embargo |
Analysis
Based on preliminary results (note: performance rates are currently under CMS embargo, and the projected availability of this information is Q3 2025), Medicare CQMs showed lower performance compared to the Web Interface on outcomes. Research indicates that the difference between the two reporting methods falls within the expected standard deviation when transitioning from sampling to scaled electronic population reporting.
This suggests that the variations in Medicare CQMs are typical, forming the benchmark. While Web Interface reporting is annual, Medicare CQMs can be run as frequently as desired. We plan to update data monthly, then move to weekly or daily updates as needed. This information can now be automatically delivered to the point of care, more accurately highlighting patient quality gaps throughout the year.
In addition to our preliminary results, our calculations show that it costs an average of $50 per chart review to close a care gap in our previous quality reporting methods. Even under a sampling methodology, this cost has posed a significant administrative burden. With new reporting requirements mandating a larger patient sample size, labor costs are expected to rise accordingly.
As the reporting population scales, organizations like this ACO face a critical challenge: they often lack the administrative capacity to conduct individual chart reviews at scale. The average cost of $50 per chart reflects the specialized expertise required to interpret unstructured clinical data. In some cases—such as reviewing C-section infection rates – industry standards necessitate chart reviews by registered nurses (RNs), further increasing labor costs.
Web Interface reporting does not currently scale effectively within our healthcare ecosystem. As a result, we are exploring alternative methodologies that extend beyond government contracts to include commercial applications and other areas.
| Measure # | Measure Title | CMS Web Interface (Sample) | Medicare CQM Performance Rate (12,000) | Delta between web interface reporting and Medicare CQMs |
|---|---|---|---|---|
| 001 | Diabetes: Hemoglobin A1c (HbA1c) Poor Control (>9%) | CMS embargo | CMS embargo | 26.23% |
| 134 | Screening for Depression and Follow-Up Plan | CMS embargo | CMS embargo | 22.75% |
| 236 | Controlling High Blood Pressure | CMS embargo | CMS embargo | 5.50% |
Resource Allocation
Internal (MultiCare):
- 2.25 FTEs for technical and architecture resources over course of project
- 1.25 FTE across Program and Project leadership and Operational SMEs
Quality Measure Calculator
As a part of the infrastructure to complete the task a calculator is needed to produce the end score. We are experimenting with calculators and participate in the NCQA Bulk FHIR Coalition to further understand the compliance of calculators in this modern architecture. Infor’s solution met this need to be able to ingest raw FHIR, calculate the score, and hand back the results.
Infrastructure
Cost to operate the MultiCare API Management (APIM) portal, also referred to as Population Health Intelligence Platform (PHIP) for April 2025, was under $8,000 in cloud compute costs.
A breakdown of services utilized for cloud compute is listed in Appendix A. It is a reasonable estimate to budget for ongoing monthly processes with the following considerations:
- The API Management service in PROD would be lower, with a once per month pull, as several pulls were completed in April from Epic, our Electronic Health Record (EHR), to finalize data for measure engine.
- The charges for microsoft.healthcareapis/workspaces (FHIR Service) will increase as we grow the data.
- Our population was 20% of the expected population for 2025 - This will increase our costs across the board.
Discussion
During the 2024 reporting period, one of the main contributors to the quality data, MultiCare Yakima Memorial Hospital, deprecated their existing EHR eClinicalWorks and migrated to Epic mid-year. Due to this, the team had to convert the final copy of eClinicalWorks to FHIR utilizing Azure FHIR services; this would be a rare occurrence for most of those replicating this infrastructure. It is also why we did not explore the FHIR bulk extract option with eClinicalWorks.
The EMR workflow did not generate a discrete data point that specified a measure requirement for Depression Screening and Follow-up. This data point consisted of the results of depression screening (either positive or negative). It was necessary to apply an additional layer of logic to the raw FHIR data to fulfill the measure requirement. All other requirements were met within the raw FHIR payloads.
A concern was encountered with the anonymizer tool that used to deidentify patient data being sent into the measures engine. It was found that the birth dates for patients over the age of 90 years old were being dropped during data ingestion, causing errors. The MCC and Infor project team met to review the measure specifications and requirements and determined that for all measures being reported for PY2024, those over 90 years of age were excluded from the eligible population. Therefore, it was deemed to be inconsequential, and the team decided to cap the age range for all patients at January 1, 1935, as this would not affect the results.
The project team initially expected a need for greater data manipulation and lower data quality output. However, FHIR provided unexpectedly robust data quality. This gives us confidence that we will achieve similar outcomes as we scale to 52,000 lives using Medicare CQMs for the 2025 performance reporting.
Furthermore, our analysis indicates that the solution’s data ingestion, transformation, and analytics and reporting components can each be developed as standalone products to support any health system operating within value-based care models that require quality reporting, and these products are both repeatable and scalable.
Conclusion
Today’s quality reporting is hindered by limitations in capability and the capacity of clinicians to report quality at scale. To foster innovation and enhance the standard of care, it is imperative that we refine the quality reporting system. Based on our findings with the MSSP program, we see immense potential for the use of open standard APIs and bulk FHIR. Although bulk does not work in the real-world testing with some of the most prominent EHRs, we hope to encourage the prioritization and investment of resources in improving the bulk capabilities of the EHRs.
Appendix
A. Cloud Compute Services Utilized
- API Management service
- App Service plan
- App Service web app
- Container registry
- Disk
- Event Hubs namespace
- Key vault
- Log Analytics workspace
- microsoft.healthcareapis/workspaces
- Private endpoint
- SQL server
- Storage account
- Synapse workspace
- Virtual machine
B. Quality Reporting: Web Interface Reporting Costs
MSSP Submission – 10 measures with 250 patients per measure
- 3 Months to complete.
- Estimated work hours: 360
-
Six different team members
Cost Estimate: $45,000
| MSSP Annual Quality Submission Process Steps | Work Hours | Rate | Total |
|---|---|---|---|
| Receive Sample File, MRN matching, Assess Primary Clinics, Organize by Measure and Clinic | 4 | $75 | $300.00 |
| Receive final definitions. Assess measure specification changes | 4 | $75 | $300.00 |
| Prep Files to send to PA (Jessica) | 2 | $75 | $150.00 |
| PA & MMA queries to pull in clinical data points | 160 | $125 | $20,000.00 |
| Create CIN files & connect with integrated network clinics to receive data via phonecall. | 3 | $75 | $225.00 |
| Receive completed files from PA and pull data back together. | 6 | $75 | $450.00 |
| Clinical Team Handoff. Update files with measure specs, pull file together, data formatting, meet with team member to handoff. | 10 | $75 | $750.00 |
| Manual chart review to find evidence of gap closure and record findings on spreadsheet (2 FTE x 2 Weeks) | 140 | $150 | $21,000.00 |
| Receive dataset back from Clincal Team. Pull data back together | 5 | $75 | $375.00 |
| Calculate Best Rate | 4 | $75 | $300.00 |
| Conduct final data pull from Claims (with Shannon) and Innovaccer | 4 | $75 | $300.00 |
| Prep final files for Jessica for submission | 3 | $75 | $225.00 |
| Review submission numbers, correct and resubmit as needed | 3 | 475 | $225.00 |
| Attend CMS Meetings | 8 | $75 | $600.00 |
| Attend MCC Data Submission Huddles | 4 | $75 | $300.00 |
| Totals | 360 | $45,000.00 |
C. FHIR Resources
USCDI v1 Plus Elements
|
|
|
D. Partners

MultiCare Connected Care (MCC) is an independent Accountable Care Organization (ACO) established in 2014 as a wholly owned subsidiary of MultiCare Health System and operates as an independent entity. MCC has established a comprehensive Clinically Integrated Network (CIN) comprised of doctors and other health care providers, as well as hospitals, clinics and other health care services, such as imaging, labs and pharmacies. The CIN includes independent health care professionals in the community, as well as MultiCare providers totaling over 3,600 clinicians providing services across the continuum of care. MCC is a physician-led organization with its own governing board and offers a commercial health benefit plan focus plus Medicare Shared Savings Program (MSSP) and is fast becoming the population health engine representing MultiCare Health System and its independent partners, in transforming health care in our region. multicareconnectedcare.com
MultiCare’s roots in the Pacific Northwest go back to 1882, with the founding of Tacoma’s first hospital. Today, our comprehensive system of health includes more than 300 primary, urgent, pediatric and specialty care locations across Washington, Idaho and Oregon, as well as 13 hospitals. We welcome patients from the entire Pacific Northwest region and our 20,000-plus team members — including employees, providers and volunteers — proudly care for the communities we serve.
Without a doubt, our organization has changed over the years. But what has never changed, throughout our long history, has been our dedication to health and wellness of the people of the Pacific Northwest. Guided by our mission, vision and values, we are on continuous journey to deliver the services that our communities need, and to ensure access to those services, now and in the future.

Infor is an industry-leading provider of cloud-based solutions built specifically for the healthcare industry. Our comprehensive platform, Infor CloudSuite™ Healthcare, helps health systems operate more efficiently, unify siloed data, and support their workforce. Infor also offers the leading interoperability engine, Infor Cloverleaf®, which provides powerful capabilities for real-time, secure data exchange across EMRs, labs, GPOs, and other critical systems. Supporting a wide range of standards, including HL7, FHIR, and X12, Cloverleaf helps connect legacy systems with modern applications. Together with our purpose- built ERP and HCM solutions, Infor helps providers streamline workflows, reduce administrative burden, and spend more time delivering high-quality care.
Infor also offers Infor Population Health Analytics (IPHA), a cloud-native platform that transforms data from multiple sources into meaningful, population-level intelligence. More than a compliance tool, IPHA empowers healthcare organizations to take action by surfacing insights that support care quality, clinical performance, and strategic decision-making. The platform ingests and standardizes data across fragmented systems, supporting use cases ranging from eCQMs and HEDIS to risk stratification, gaps-in- care analysis, cohorting, predictive modeling, and outcomes reporting—all within a scalable, analytics- ready architecture.
As part of this collaboration, IPHA was deployed to automate the calculation of CMS electronic clinical quality measures (eCQMs) across a defined patient population. The system securely extracted clinical data from a FHIR store, applied anonymization as part of the processing pipeline, and converted the data into longitudinal patient charts. These records were stored in a high-performance, cloud-native FHIR repository optimized for advanced analytics.
IPHA’s calculation engine—designed to scale horizontally in the cloud—processed each patient record to compute targeted quality measures. For every patient, the engine generated detailed measure outputs with transparent inclusion and exclusion logic, enabling care teams to quickly identify data or care gaps.
The platform also generated submission-ready files in CMS QPP-compliant JSON format and performed automated data quality checks. These checks identified missing attributes and unresolved references early in the pipeline, enabling technical teams to implement targeted data transformation and enrichment logic before calculation, thereby ensuring data accuracy and completeness.
This project was the result of deep collaboration between Infor and MultiCare’s clinical, data, and technical teams, working side by side to solve real-world interoperability and quality measurement challenges. Together, we demonstrated how IPHA can power clinical quality initiatives through a modern, standards-based approach that is scalable, transparent, and purpose-built for healthcare organizations navigating value-based care.

Microsoft is a multinational technology company headquartered in Redmond, WA and founded in 1975. It is a leader in AI technology and has also developed technology to serve specifically the healthcare industry. Its Azure Health Data services provides a cloud-based platform to help healthcare organizations ingest, store, manage, and analyze health data from diverse sources and formats. It’s built on open standards like FHIR and DICOM, enabling interoperability and advanced analytics across clinical data.
By leveraging Microsoft’s Azure Health Data Services, MultiCare has positioned itself as a digital health leader—accelerating the shift from legacy systems to a modern, cloud-native architecture. This enables rapid deployment of new digital health solutions, supports virtual care, and future-proofs MultiCare’s Pop Health investments. The platform’s foundation on open standards (FHIR, DICOM) and support for SMART on FHIR empowers MultiCare to seamlessly connect with external providers, payers, and third-party innovators. This strategic interoperability unlocks new care models, enables value-based care partnerships, and supports population health initiatives.
Since Azure Health Data Services is designed for protected health information (PHI), with built-in compliance for HIPAA, GDPR, and CCPA from the ground up, MultiCare can assure patients, partners, and regulators that PHI is protected. This reduces risk, simplifies audits, and strengthens MultiCare’s reputation as a trusted healthcare provider.
This developer and partner friendly platform and services environment, combined with RESTful APIs and Azure API Management, has allowed MultiCare to rapidly prototype, test and scale new applications. The agility provided supports the innovation in patient engagement, clinical workflows, and operational efficiency that MultiCare was looking to achieve.
E. Other reference articles:
https://www.acpjournals.org/doi/abs/10.7326/0003-4819-158-1-201301010-00006
https://www.sciencedirect.com/science/article/abs/pii/S1553725017305536